5. Sankey plotting of inter- and intracellular communication
Language: R · Input: LR_data_final.Rds
In this step, we will visualise the inter- and intracellular communication events that CrossTalkeR2 identified. Starting from the final CrossTalkeR object, we draw the ligand–receptor Sankey for the Il1b → Il1r1 axis, the intracellular signalling graph downstream of Il1r1 in MSCs, and a ranking of the strongest differential cell–cell interactions.
Load the CrossTalkeR object
We start by loading the required libraries and the final CrossTalkeR object produced in the previous step.
library(CrossTalkeR)
library(dplyr)

BASE    <- "/path/to/Il1rn_KO"
CTR_OUT <- file.path(BASE, "crosstalker")

CTR_data <- readRDS(file.path(CTR_OUT, "LR_data_final.Rds"))
Top 20 cell-cell interactions by edge weight
Before we dive into the inter- and intracellular signals involving MSC’s, we can make sure that MSC’s are a central and important signaling node in the network. One way is to check the interactions edge weights in the network. We can print the top 20 cell-cell interactions on the absolute LR-Score as barplot:
edges <- igraph::as_data_frame(CTR_data@graphs[["KO_x_WT"]])
edges$edges  <- paste(edges$from, edges$to, sep = "/")
edges$signal <- ifelse(edges$weight > 0, "pos",
                ifelse(edges$weight < 0, "neg", "none"))

top <- edges %>% filter(signal %in% c("pos", "neg")) %>%
       group_by(signal) %>% slice_max(abs(weight), n = 10) %>% ungroup()

ggplot(top, aes(x = weight, y = reorder(edges, weight), fill = signal)) +
  geom_bar(stat = "identity") +
  ylab("Node Pairs") + xlab("Edge Weight") +
  scale_fill_manual(values = c("#3B4CC0", "#DD0029")) +
  theme_minimal()
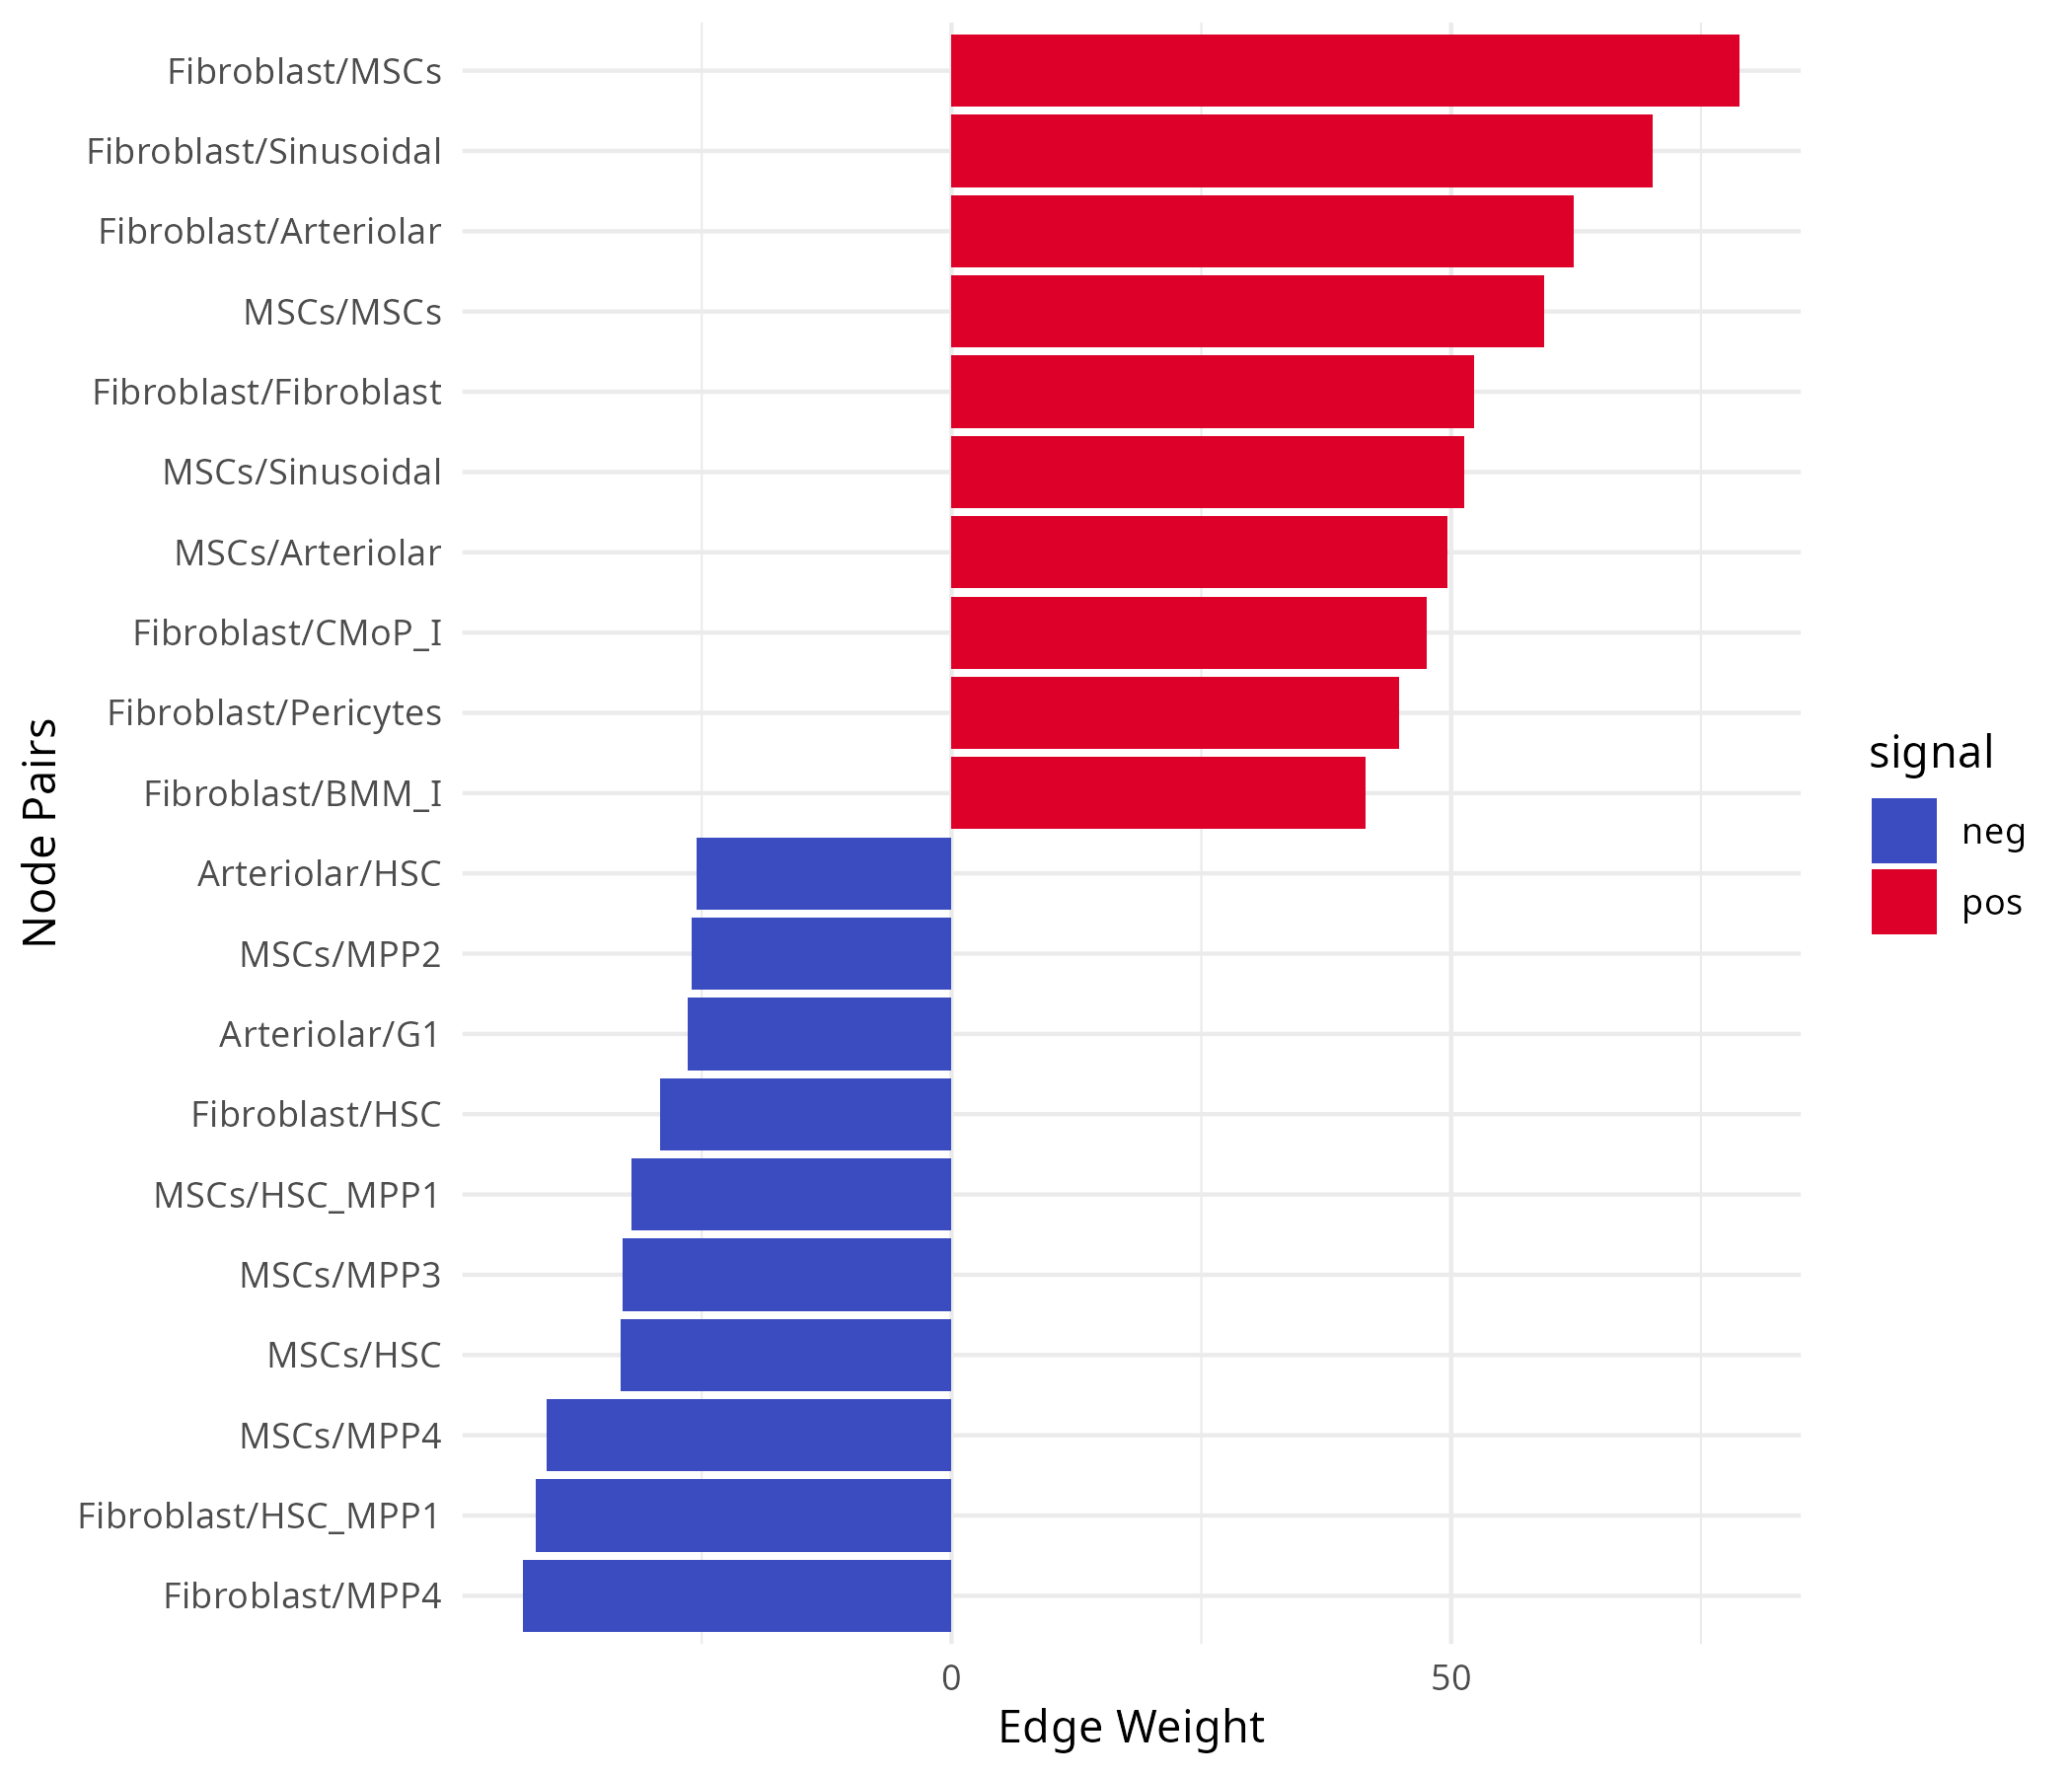
Top 20 positive and negative cell-cell interactions.
Sankey of Il1b → Il1r1_Il1rap towards MSCs
Now that we have seen that MSC’s are within the top interacting cell types, we take a look at the incoming signals to Il1r1_Il1rap in MSC’s. The best was is to plot a Sankey plot of the Ligand Receptor interactions:
table <- CTR_data@tables$KO_x_WT
table <- table[table$type_gene_A == "Ligand" &
               table$gene_A %in% c("Il1b|L") &
               table$type_gene_B == "Receptor" &
               table$gene_B %in% c("Il1r1_Il1rap|R", "Il1r2_Il1rap|R", "Il1r1|R"), ]
table <- table %>% arrange(gene_B)

plot_sankey(table,
  target    = "Il1r1_Il1rap|R",
  plt_name  = "Il1r1_Il1rap|R",
  threshold = 50,
  low_col   = "#3B4CC0",
  high_col  = "#DD0029",
  score_col = "LRScore")
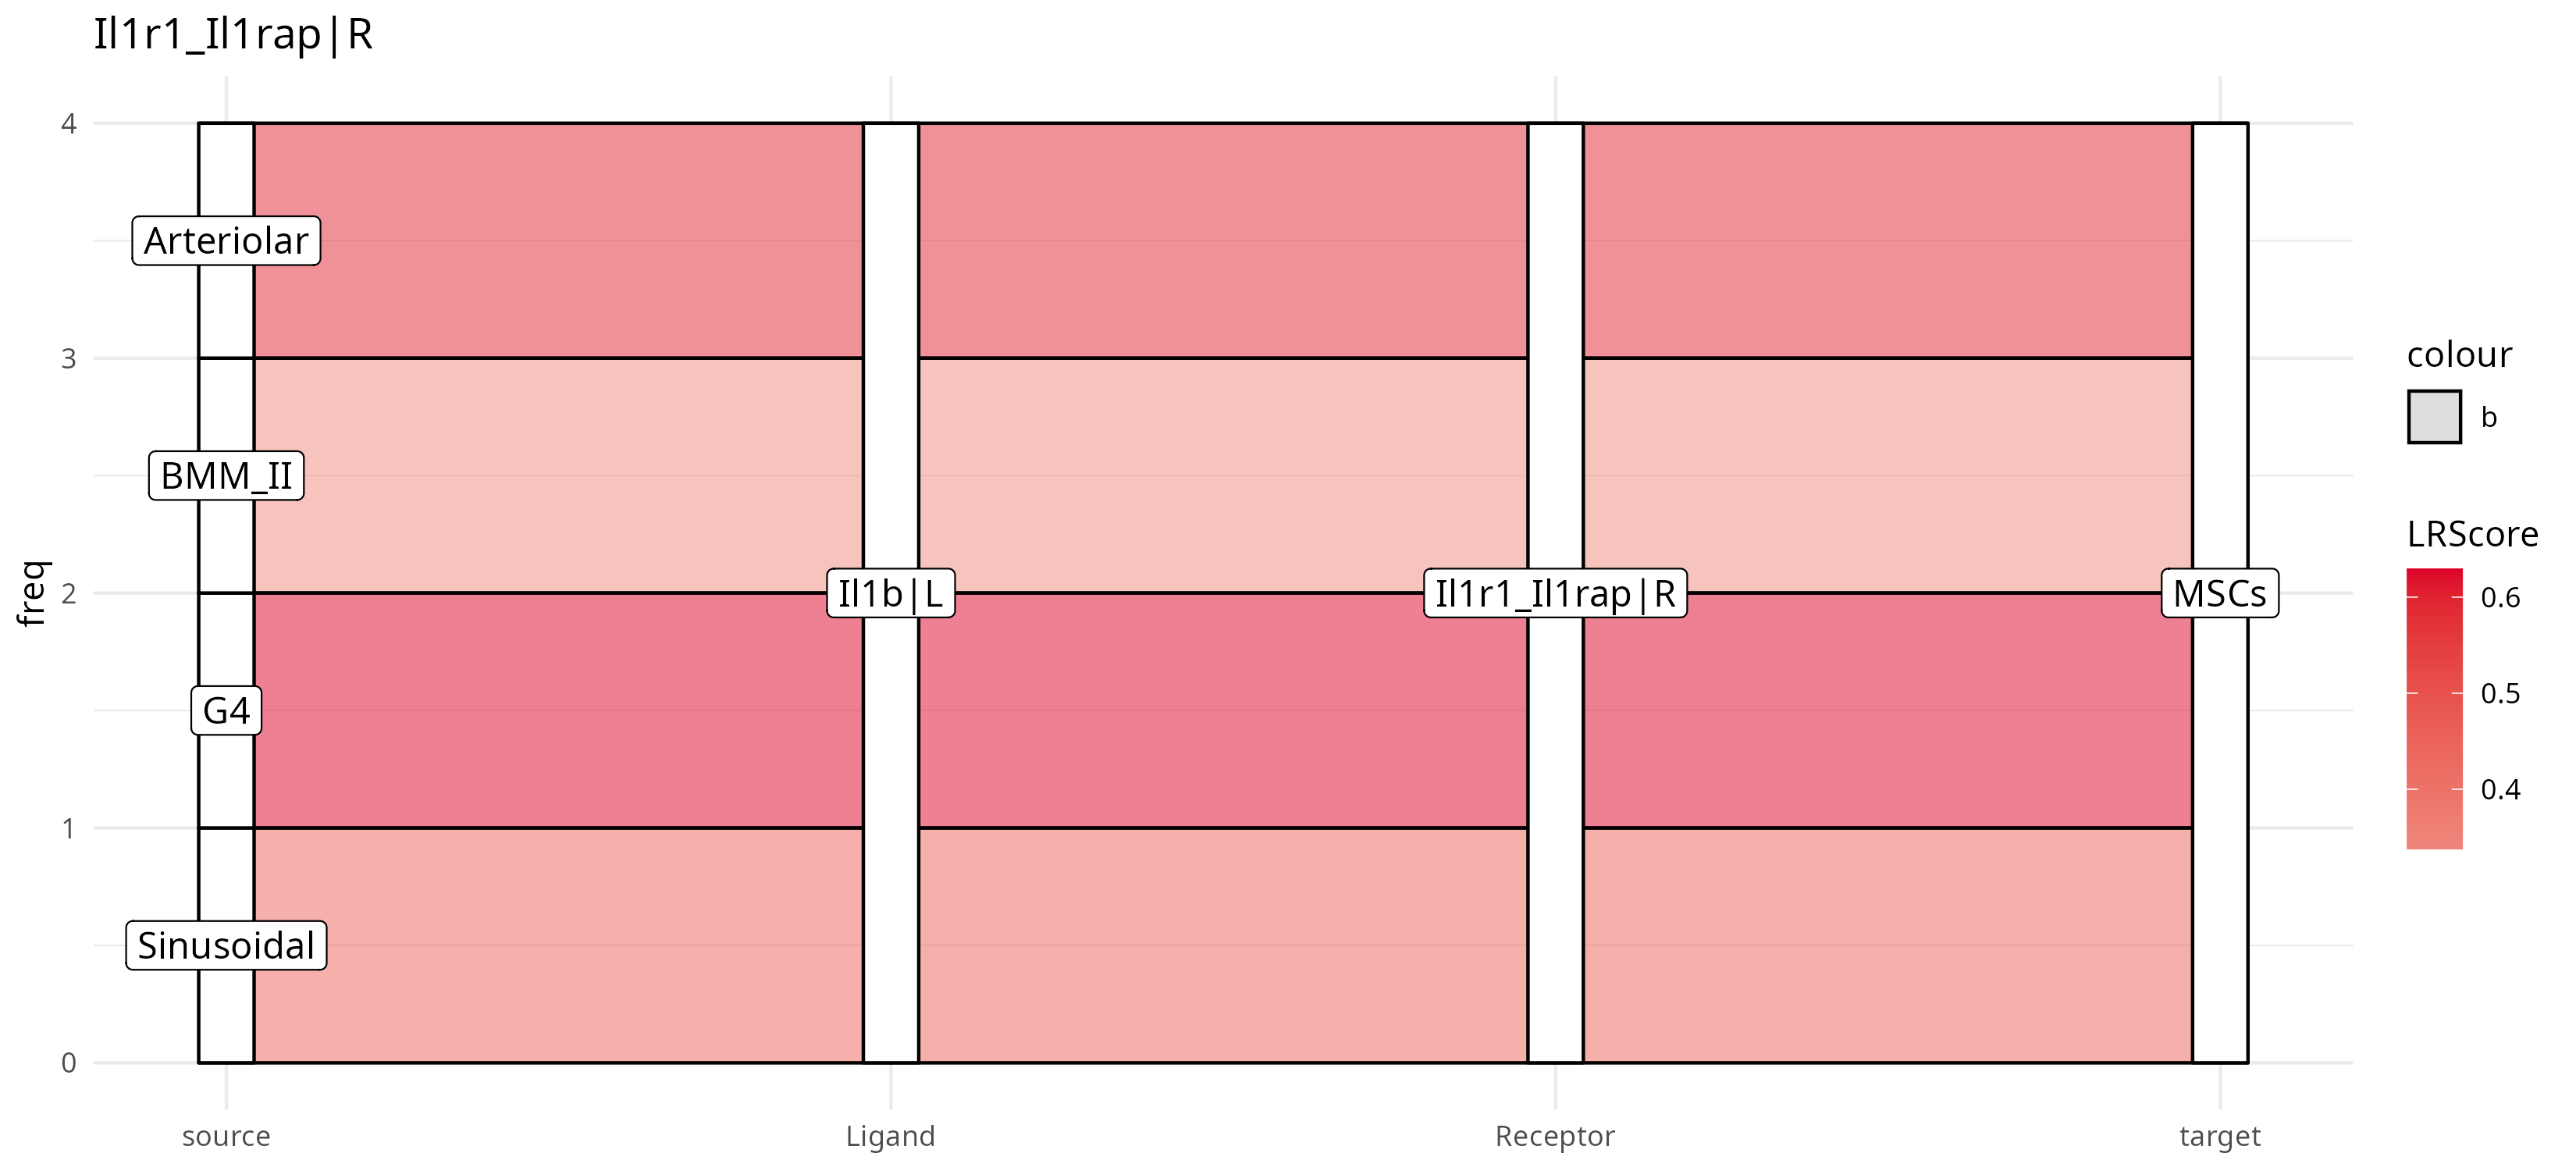
Il1b → Il1r1_Il1rap interactions towards MSCs (KO vs WT).
We can see that the Il1b–Il1r1 interactions are upregulated in KO, and the incoming signals are coming from arteriolar endothelial cells and G4 neutrophils. The signaling is exclusively targeting MSCs.
Intracellular signalling graph of Il1r1 in MSCs
Next we can trace the intracellular downstream signaling of Il1r1_Il1rap in MSCs. To plot this signaling, we first filter R-TF and TF-L interactions to only include fully connected intracellular signaling (full R-TF-L path). Then we calculate the mean LR Score for incoming signals to Il1r1_Il1rap and for each outgoing downstream L signal.
table <- CTR_data@tables$KO_x_WT
gene_list1 <- table[table$gene_A == "Il1r1_Il1rap|R" & table$source == "MSCs", ]
gene_list2 <- table[table$gene_A %in% gene_list1$gene_B & table$source == "MSCs", ]

pagerank_table <- as.data.frame(CTR_data@rankings$KO_x_WT_ggi %>% select(nodes, Pagerank))
rownames(pagerank_table) <- pagerank_table$nodes

# InterScore = mean LRScore over all intercellular interactions using that R (or L)
LR_receptors <- table[table$gene_B %in% gene_list1$gene_A & table$target == "MSCs", ]
LR_ligands   <- table[table$gene_A %in% gene_list2$gene_B & table$source == "MSCs", ]

rec_scores <- sapply(unique(LR_receptors$gene_B),
                     \(r) mean(LR_receptors[LR_receptors$gene_B == r, ]$LRScore))
lig_scores <- sapply(unique(LR_ligands$gene_A),
                     \(l) mean(LR_ligands[LR_ligands$gene_A == l, ]$LRScore))

gene_list1 <- gene_list1[gene_list1$gene_A %in% names(rec_scores), ]
gene_list1$InterScore <- rec_scores[gene_list1$gene_A]
gene_list2$InterScore <- lig_scores[gene_list2$gene_B]

# node size: mean LRScore per TF across both hops
tf_scores <- rbind(rename(gene_list1[, c("gene_B", "LRScore")], gene = gene_B),
                   rename(gene_list2[, c("gene_A", "LRScore")], gene = gene_A))
gene_avg  <- rename(aggregate(LRScore ~ gene, tf_scores, mean, na.rm = TRUE),
                    AvgTFScore = LRScore)
gene_list1 <- merge(gene_list1, gene_avg, by.x = "gene_B", by.y = "gene", all.x = TRUE)
gene_list2 <- merge(gene_list2, gene_avg, by.x = "gene_A", by.y = "gene", all.x = TRUE)

top20_tf2L <- gene_list2[order(abs(gene_list2$InterScore), decreasing = TRUE), ][1:20, ]

plot_graph_sankey_tf_custom(
  gene_list1,
  top20_tf2L,
  "MSCs",
  "InterScore",
  pagerank_table,
  outpath     = PLOTS,
  file_name   = "Intra_Sankey_Il1r1_MSC_Top20",
  legend_name = "mean(LRScore of R or L)",
  min_max_val = 1,
  title       = "Il1r1 MSCs mean(LRScore) Top 20 ligands",
  size_node   = "fixed_size",
  colors      = c("#3B4CC0", "#D1EAFA", "#e3e3e3", "#F9AC9F", "#DD0029"))
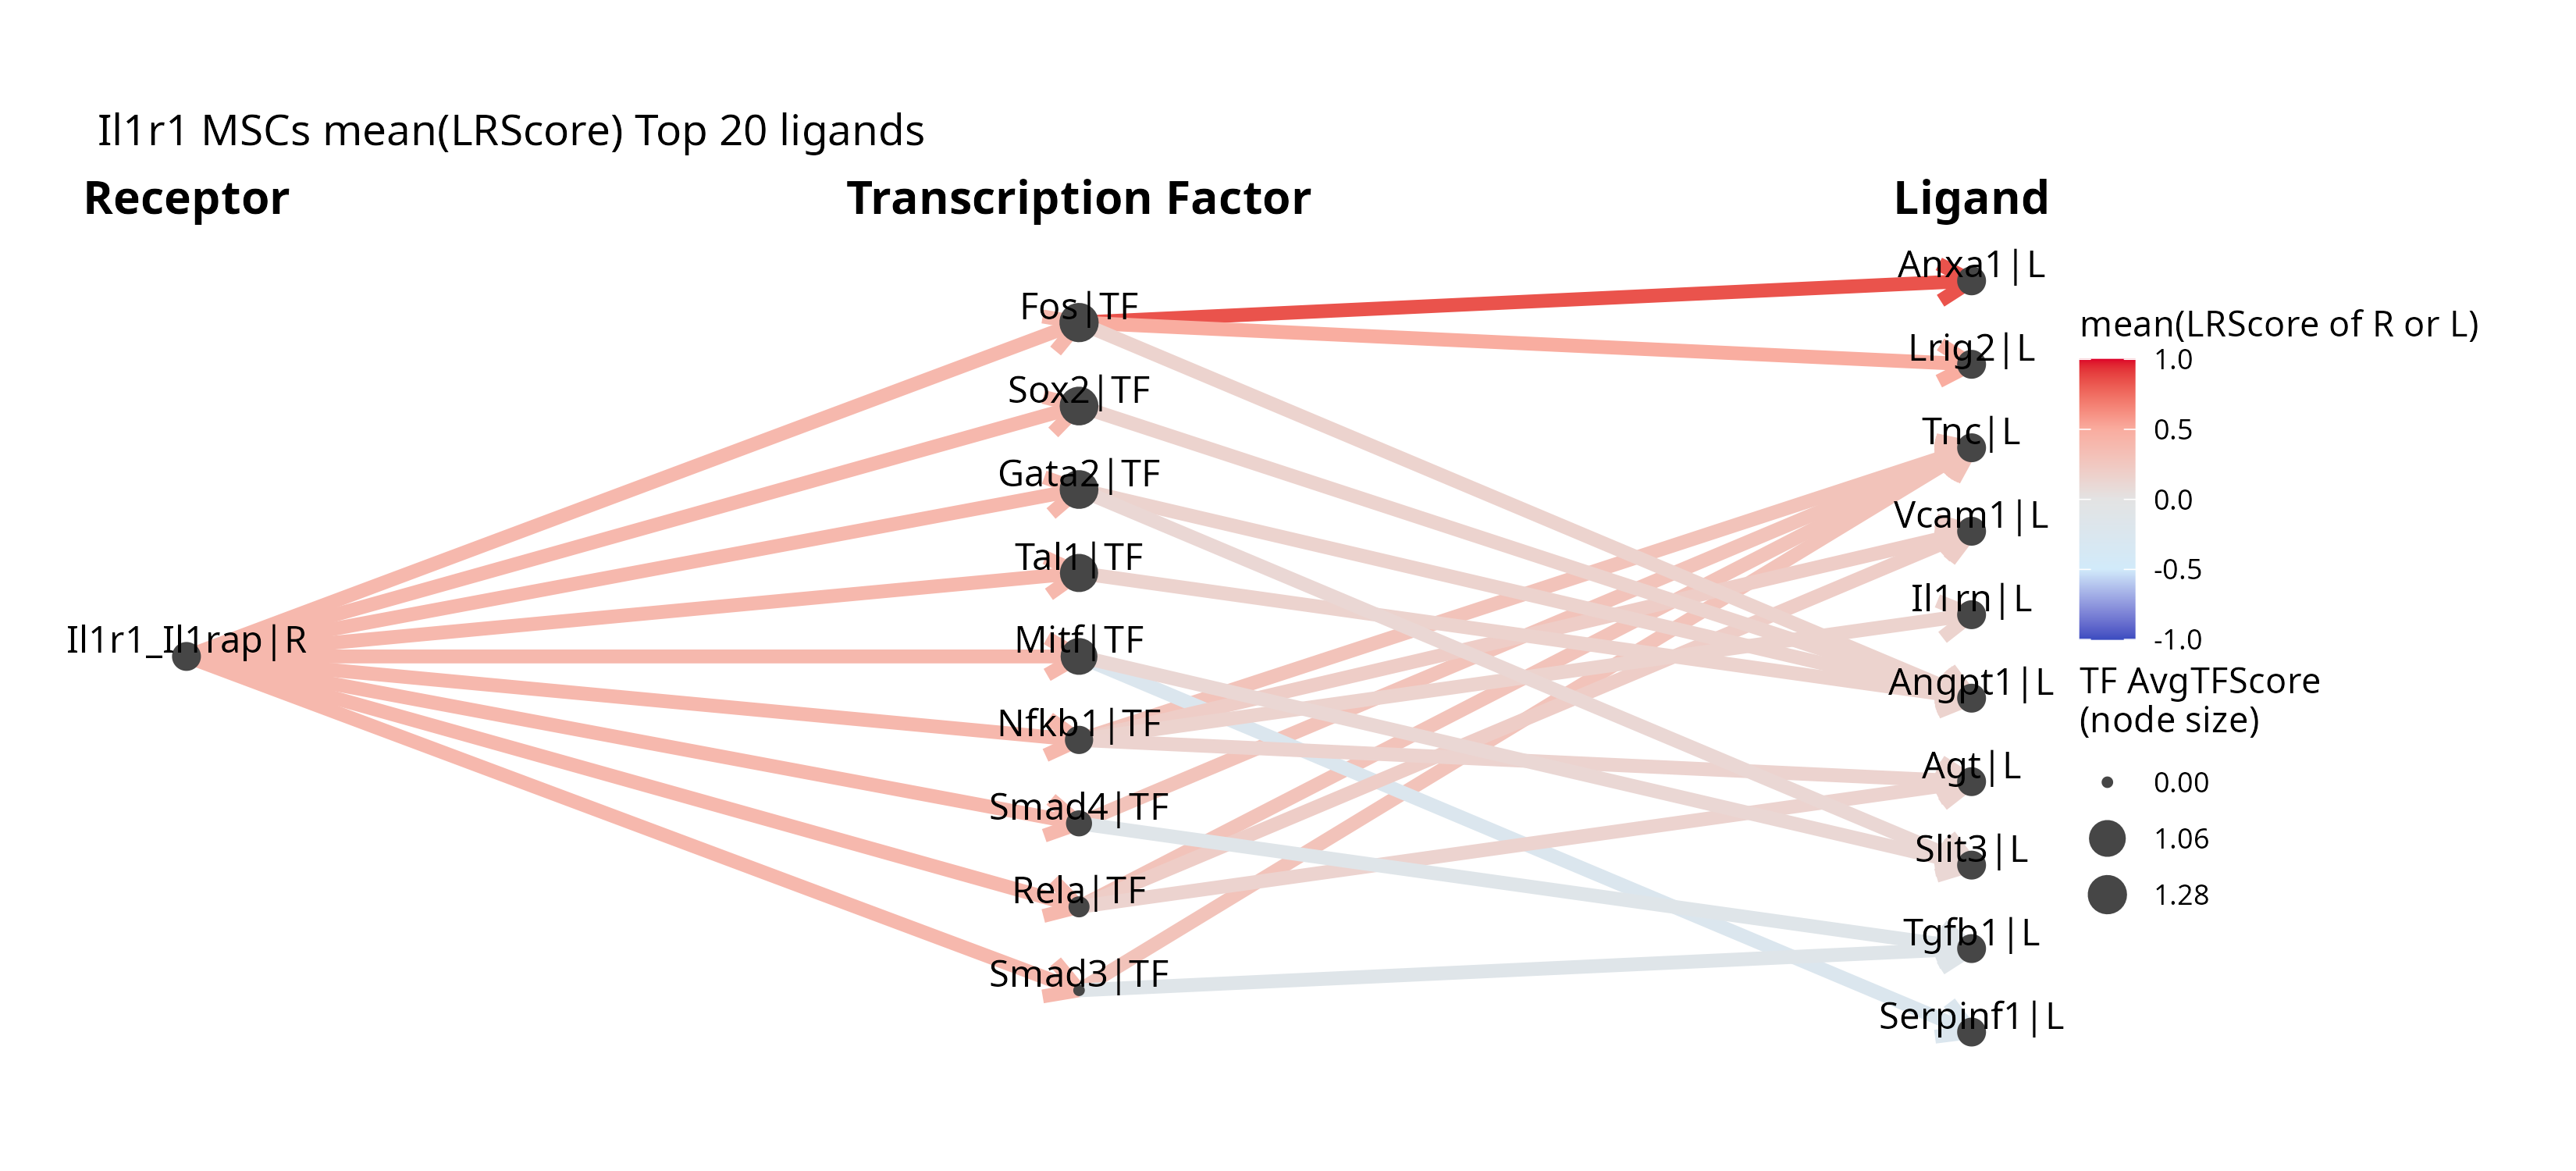
Intracellular signalling downstream of Il1r1 in MSCs (top 20 ligands).
Nfkb1 appears as a mediator of Il1r1 signalling (the canonical NF-κB route), alongside fibrosis-related Smad3/Smad4, which upregulate the Tnc ligand.
Handoff: R → Python
The analysis returns to Python. Three sets of files cross: