Pipeline basics
Overview
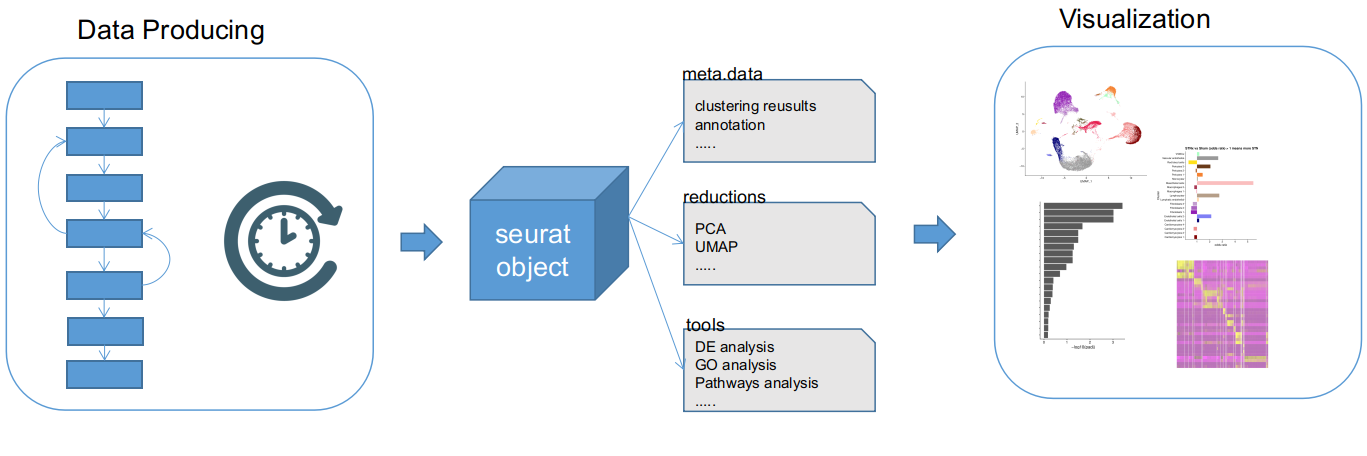
The pipeline consists of two steps: data producing and visualization. Basically the data producing prepares all analyses and store the results in a SeuratObject. This step can take really long time(hours or days). The visualization loads the SeuratObject and generates a report and plots in png&pdf format.
General steps
- Give a name to your experiment. Assume your experiment name is
experiment1, please:a) create
conf/conf_experiment1.R. b) copyrun_example.shandrun_viz_example.shtorun_experiment1.shandrun_viz_experiment1.sh -
Adjust
conf/conf_experiment1.Rto your experiment. Please note this step is important. -
sh run_experiment1.sh experiment1to run thedata producing. -
sh run_viz_experiment1.sh experiment1to run the visualization if there's no error ofdata producing - Open the file
experiment1/report/index.htmlto check the report.
Settings
It is worth notice that checking the configuration file is the most important thing before you are about to run the pipeline.
settings - initial info
ORGAN is related a celltype gene markers file, so that only a few of organs are available for now.
MCA_NAME and HCL_NAME are related to Mouse Cell Atlas and Human Cell Landscape respectively. The pipeline utilize them to annotate celltypes for each cell.
MINCELLS and MINGENES are just preliminary filtering threshold. The pipeline also set other filterings, please find help by run Rscript data_factory --help to get more detail.
INTEGRATION_OPTION: you can choose either seurat or harmony to integrate different tissues.
### --------------Initial info----------------------------
PROJECT = "Mouse Blood project" ## set project name
ORGAN = 'Blood'           #For external annotation. Options: Blood, Heart, Intestine, Kidney
SPECIES = "Mouse"         #For external annotation. Options: Human, Mouse
MCA_NAME = "Bone-Marrow" #For MCA annotation.      Options: check http://bis.zju.edu.cn/MCA/
HCL_NAME = "Adult-Bone-Marrow-CD34P" #For HCL annotation.

# filtering params when create seurat object
MINCELLS  = 5
MINGENES  = 50

INTEGRATION_OPTION = "seurat" ### or harmony
settings - data source
ANNOTATION_EXTERNAL_FILE is the celltype gene markers file aforementioned. You can add more markers as long as the format is consistent.
MSigDB_GENESET_HUMAN_GMT_FILE is genesets collected by GSEA, since it is a gmt file, you can also append more genesets or specify another gmt.gz file.
data_src keeps the input count matrix. Supported format is 10X and 10X_h5. Left side names are the name of the sample, right side values is the 10X directories or h5 file names.
### -------------- Data SRC-----------------------------
ANNOTATION_EXTERNAL_FILE = "external/Human_and_mouse_cell_markers-Markers.tsv"

## If genesets you need are not included, please attach your geneset to the gmt.gz file.
MSigDB_GENESET_HUMAN_GMT_FILE  = "external/Human_msigdb.v7.2.symbols.gmt.gz"

data_src = c(
      A_MxCre    =   "data/A_MxCre",
      B_MxCre    =   "data/B_MxCre",
      C_Csnk     =   "data/C_Csnk",
      D_Csnk     =   "data/D_Csnk"
)
setttings - replicate group
stage_lst keeps the groups of samples, left side names are samples' names, right side values are group names. If there's no replicates, or you don't need to group samples, you can set each group name the exact sample name.
stage_lst = c(
        A_MxCre      =   "MxCre",
        B_MxCre      =   "MxCre",
        C_Csnk       =   "Csnk",
        D_Csnk       =   "Csnk"
)
settings - variables to regressout
preprocess_regressout indicate which variables to be regressout for integration. Please set to 0 if you don't want to regressout during the integrating.
preprocess_regressout = c("mito"       = 1,
                          "ribo"       = 0,
                          "cellcycle"  = 1
                         )
settings - genesets
MSigDB_Geneset_names select the geneset names in MSigDB_GENESET_HUMAN_GMT_FILE.
MSigDB_Geneset_names <- c(
    "NABA_COLLAGENS",
    "NABA_SECRETED_FACTORS",
    "NABA_ECM_GLYCOPROTEINS",
    "NABA_CORE_MATRISOME",
    "NABA_ECM_REGULATORS",
    "NABA_MATRISOME_ASSOCIATED",
    "NABA_ECM_AFFILIATED",
    "NABA_BASEMENT_MEMBRANES",
    "NABA_PROTEOGLYCANS",
    "NABA_MATRISOME"
)
settings - execution plan
Execution plan conf is almost the most important setting that you need to modify frequently. It defines how to run your pipeline data producing. The pipeline data producing includes 3 main steps:
- scrna_phase_preprocess: load data, filter cells, regressout variables and ambient RNA detection.
- scrna_phase_clustering: integration, clustering, MCA, HCL annotation etc.
- scrna_phase_comparing: DE, GO, pathways, genesets analyses etc.
Each step will accumulately store the result into a SeuratObject with corresponding name, e.g. scrna_phase_preprocess will store to scrna_phase_preprocess.Rds when this step is done. All rest functions like scrna_merge_clusters will store to scrna_phase_comparing.Rds.
If you have produced scrna_phase_preprocess, and need to redo the integration and clustering, just set scrna_phase_preprocess to 2. If you have already got a SeuratObject, just named it as scrna_whatever_xxx.Rds, add an option scrna_whatever_xxx=2, the pipeline will load this file and perform the rest plans that you set to 1.
Please note that, the pipeline can also perform clusters removal or merging. Which are connected to settings like scrna_merge_clusters, scrna_remove_clusters and scrna_remove_recluster.
### -------------- RUN PARAMETERS-----------------------------

## 0. omit,     1. calc & save,      2. load
conf = c(
       scrna_phase_preprocess     = 1, ## quality check and preprocessing before integration
       scrna_phase_clustering     = 1, ## integration & clustering
       scrna_phase_comparing      = 1, ## DE GO pathway analysis etc. All rest calculating will be stored here
       scrna_cluster_annotation   = 0, ## Annotate clusters according to `cluster_annotation`
       scrna_clusterwise_xcell    = 0, ## remove cells of each cluster according distinct criterion
       scrna_del_mitogenes        = 0, ## !!!DANGEROUS, once deleted, never recovered!!!
       scrna_merge_clusters       = 0, ## merge clusters
       scrna_remove_clusters      = 0, ## remove clusters
       scrna_remove_recluster     = 0) ## remove clusters and recluster with default resolution
settings - colors
This viz_conf list indicate how to display colors of a variaty of plots. The frequent options to be changed are cluster_color_option and replicate_color_option. Please note that some colorcodes only include less than 10 colors, choose colorcode that fit your dataset.
viz_conf = list(
  ## https://github.com/nanxstats/ggsci
  ##ggsci colorcode & availble colors:
                # "aaas":10 "d3":10 "futurama":12 "gsea":12 "igv":51
                # "jama":7 "jco":10 "lancet":9 "locuszoom":7 "material":10
                # "nejm":8 "npg":10 "rickandmorty":12 "simpsons":16 "startrek":7
                # "tron":7 "uchicago":9 "ucscgb":26

  cluster_color_option = "igv", ## ggsci, see above
  replicate_color_option = "simpsons", ## ggsci, see above
  neg_color = "#51C3CC",#colorBlindness::Blue2DarkOrange12Steps[2],
  pos_color = "#CC5800",#rev(colorBlindness::Blue2DarkOrange12Steps)[2],
  base_color = "lightgrey",#"lightgrey",
  neg_pos_divergent_palette = c('#1E8E99','#51C3CC','#99F9FF','#B2FCFF','#CCFEFF','#E5FFFF','#FFE5CC','#FFCA99','#FFAD65','#FF8E32','#CC5800','#993F00') #colorBlindness::Blue2DarkOrange12Steps
)