Creates the old version of the difference in means by sum of variances plot
Source:R/plot.R
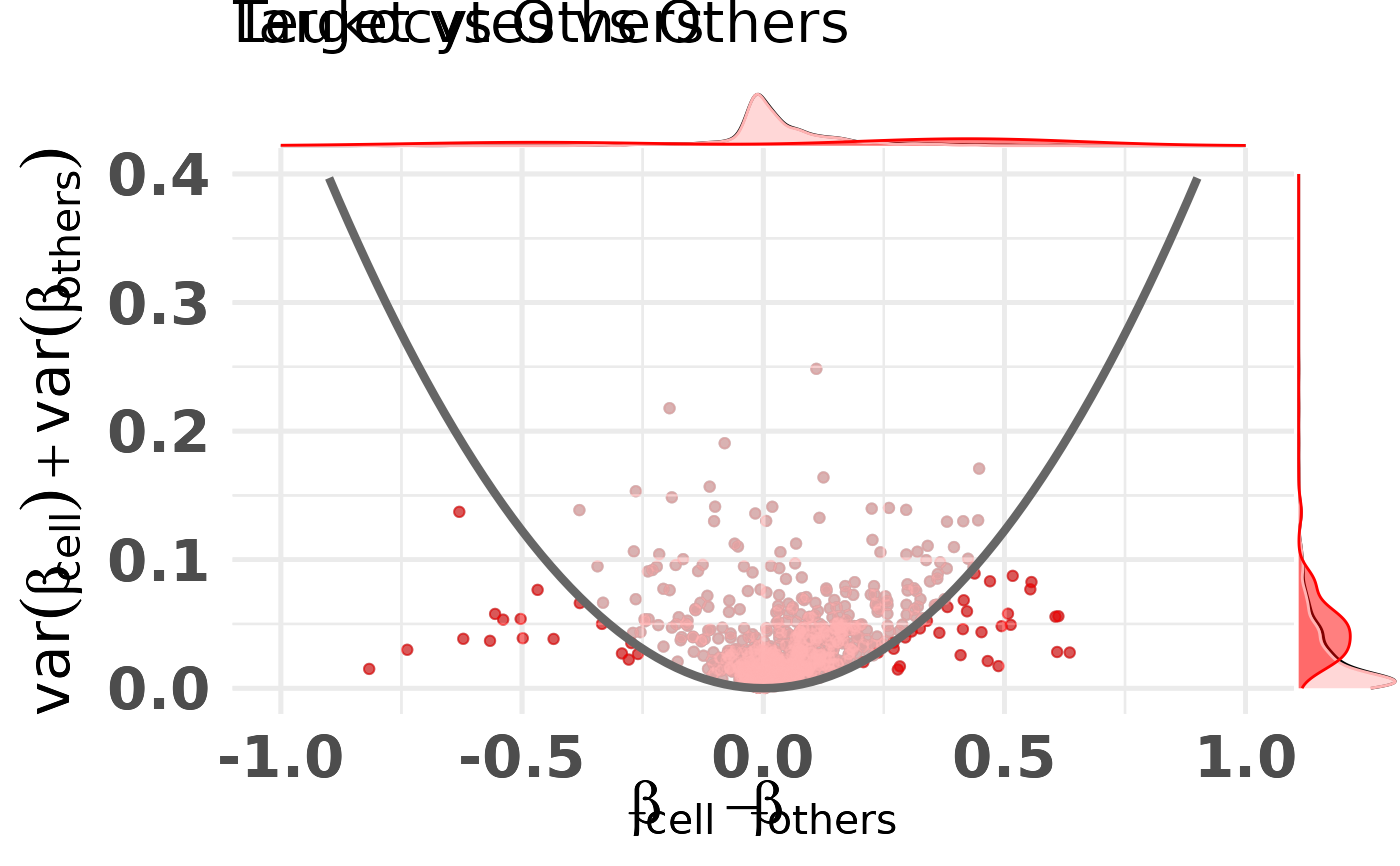
diffmeans_sumvariance_plot.RdRepresent CpGs in the difference in means, sum of variances space. This plot is often used to select CpGs that would be good classifiers. These CpGs are often located on the bottom left and bottom right of this plot.
Usage
diffmeans_sumvariance_plot(
  data,
  xcol = "diff_means",
  ycol = "sum_variance",
  feature_id_col = "id",
  is_feature_selected_col = NULL,
  label_var1 = "Target",
  label_var2 = "Others",
  target_vector = NULL,
  mean_cutoff = NULL,
  var_cutoff = NULL,
  threshold_func = NULL,
  func_factor = NULL,
  feats_to_highlight = NULL,
  cpg_ranking_df = NULL,
  color_all_points = NULL,
  plot_density = TRUE,
  density_type = c("density", "histogram", "boxplot", "violin", "densigram"),
  plot_dir = NULL,
  id_tag = NULL,
  file_tag = NULL,
  custom_mods = FALSE
)
Arguments
- data
Data to create difference in means, sum of variances plot. Either a data.frame with `xcol`,`ycol` and `feature_id_col` or, if `target_vector` is not `NULL` a matrix with beta values from which, given the target, the difference in means between the target and others, and the sum of variances within the target and others will be calculated.
- xcol
Column with x-axis data
- ycol
Column with y-axis data
- feature_id_col
Column with the feature ID
- is_feature_selected_col
NULL or column with TRUE/FALSE for features which should be highlighted as selected
- label_var1
Label of the target class
- label_var2
Label of the other classes
- target_vector
if not NULL a vector target class assignment, see data
- mean_cutoff
a numeric draw mean cutoff at given position
- var_cutoff
a numeric draw variance cutoff at given position
- threshold_func
specification of the parabola function, see examples
- func_factor
argument to be passed to the parabola function, see examples
- feats_to_highlight
features (CpGs) to be highlighted in the plot
- cpg_ranking_df
data.frame with ranked features (CpGs) to be highlighted in the plot, if present must have the following columns: .id, predType, Rank and DiffAndFoldScaledAUPR
- color_all_points
color that all non-highlighted points should have, argument defaults to NULL, the default color is black
- plot_density
A boolean, if TRUE (default) the function will produce density plots on top/side of scatterplot
- density_type
One of "density", "histogram", "boxplot", "violin" or "densigram". Defines the type of density plot if `plot_density = TRUE`
- plot_dir
path to directory where to save the plot. If NULL (default), plot will not be saved.
- id_tag
character string to identify plots, is displayed in the plot and present in the file name
- file_tag
character string to identify plots, tags only the file name
- custom_mods
a boolean, if TRUE will add some custom labels to the plot. Default is FALSE
Examples
library("CimpleG")

# read data
data(train_data)
data(train_targets)

# make basic plot
plt <- diffmeans_sumvariance_plot(
  train_data,
  target_vector = train_targets$blood_cells == 1
)
print(plt)

# make plot with parabola, colored and highlighted features
df_dmeansvar <- compute_diffmeans_sumvar(
  train_data,
  target_vector = train_targets$blood_cells==1
)
parab_param <- .7
df_dmeansvar$is_selected <- select_features(
    x = df_dmeansvar$diff_means,
    y = df_dmeansvar$sum_variance,
    a = parab_param
)

plt <- diffmeans_sumvariance_plot(
  data=df_dmeansvar,
  label_var1="Leukocytes",
  color_all_points="red",
  is_feature_selected_col="is_selected",
  feats_to_highlight=c("cg10456121"),
  threshold_func=function(x,a) (a*x)^2,
  func_factor=parab_param
)
#> Warning: Use of `sp_df$x` is discouraged.
#> ℹ Use `x` instead.
#> Warning: Use of `sp_df$x` is discouraged.
#> ℹ Use `x` instead.
#> Warning: Removed 10 rows containing missing values or values outside the scale range
#> (`geom_line()`).
#> Warning: Removed 1 row containing missing values or values outside the scale range
#> (`geom_label()`).
#> Warning: Removed 1 row containing missing values or values outside the scale range
#> (`geom_label_repel()`).
#> Warning: Use of `sp_df$x` is discouraged.
#> ℹ Use `x` instead.
#> Warning: Use of `sp_df$x` is discouraged.
#> ℹ Use `x` instead.
#> Warning: Removed 10 rows containing missing values or values outside the scale range
#> (`geom_line()`).
#> Warning: Removed 1 row containing missing values or values outside the scale range
#> (`geom_label_repel()`).
#> Warning: Use of `sp_df$x` is discouraged.
#> ℹ Use `x` instead.
#> Warning: Removed 10 rows containing missing values or values outside the scale range
#> (`geom_line()`).
#> Warning: Removed 1 row containing missing values or values outside the scale range
#> (`geom_label_repel()`).
print(plt)